Features · Charts
Eleven chart types. One renderer.
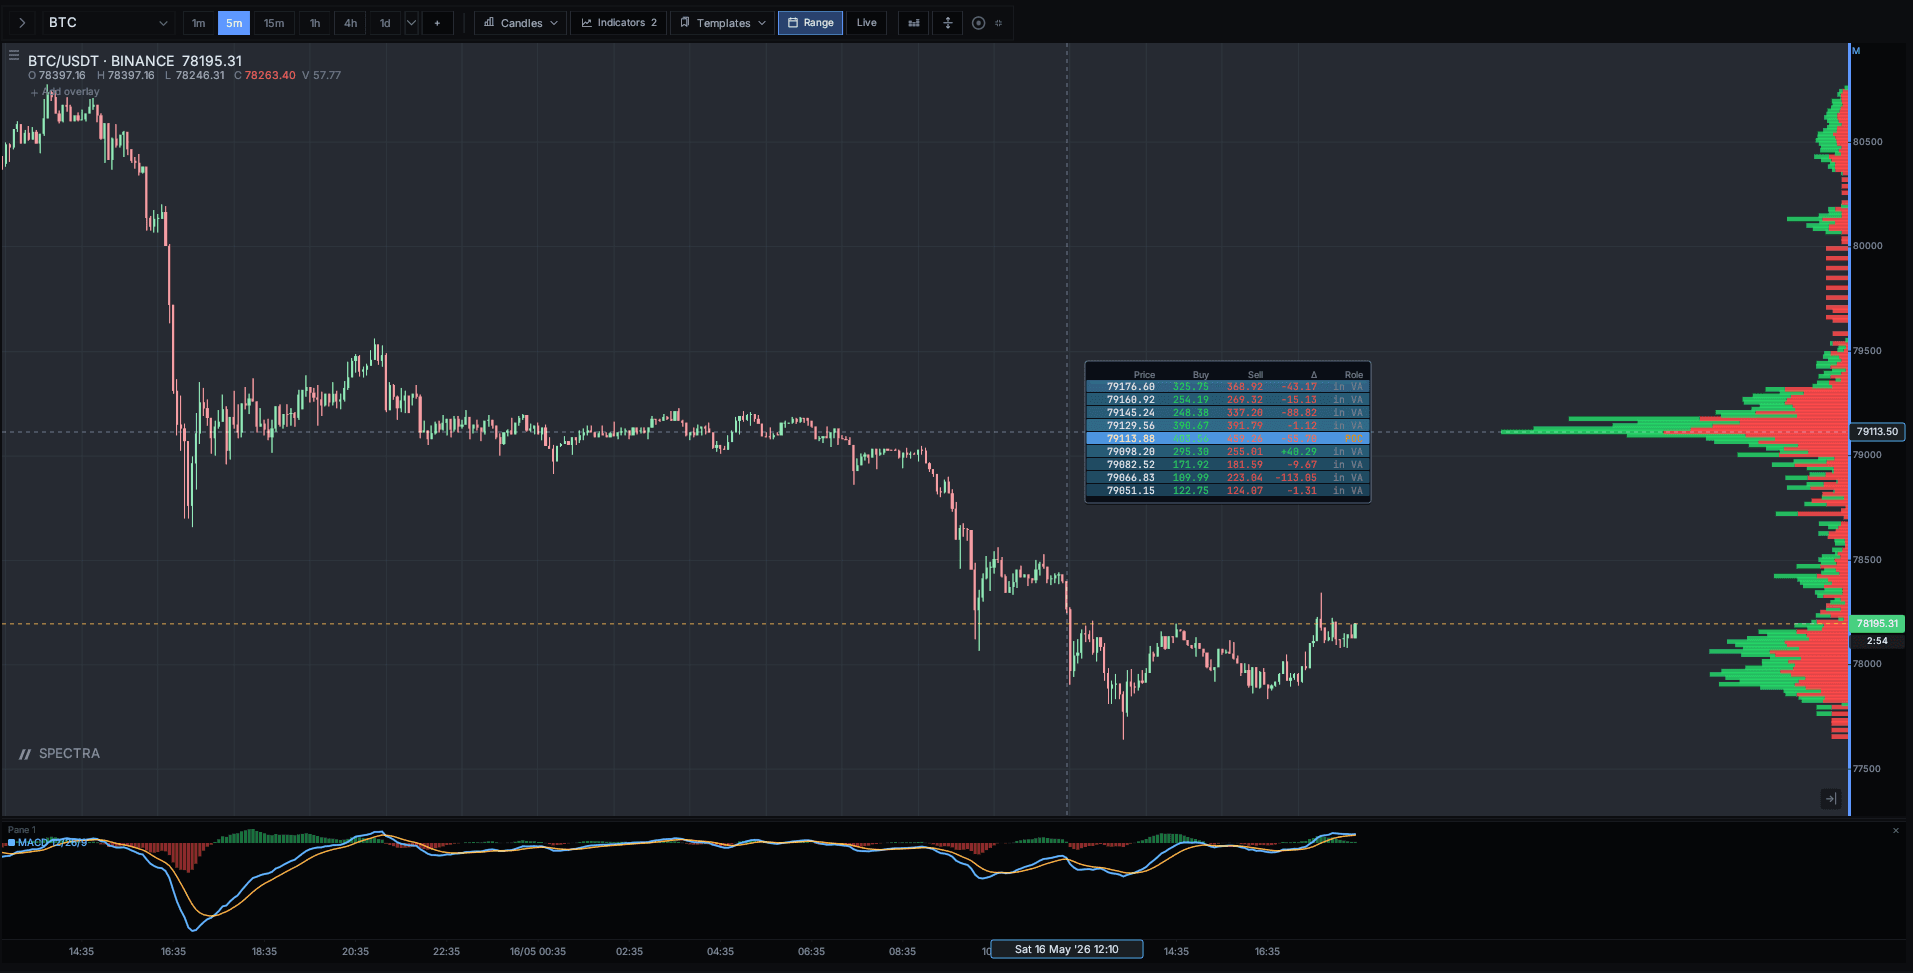
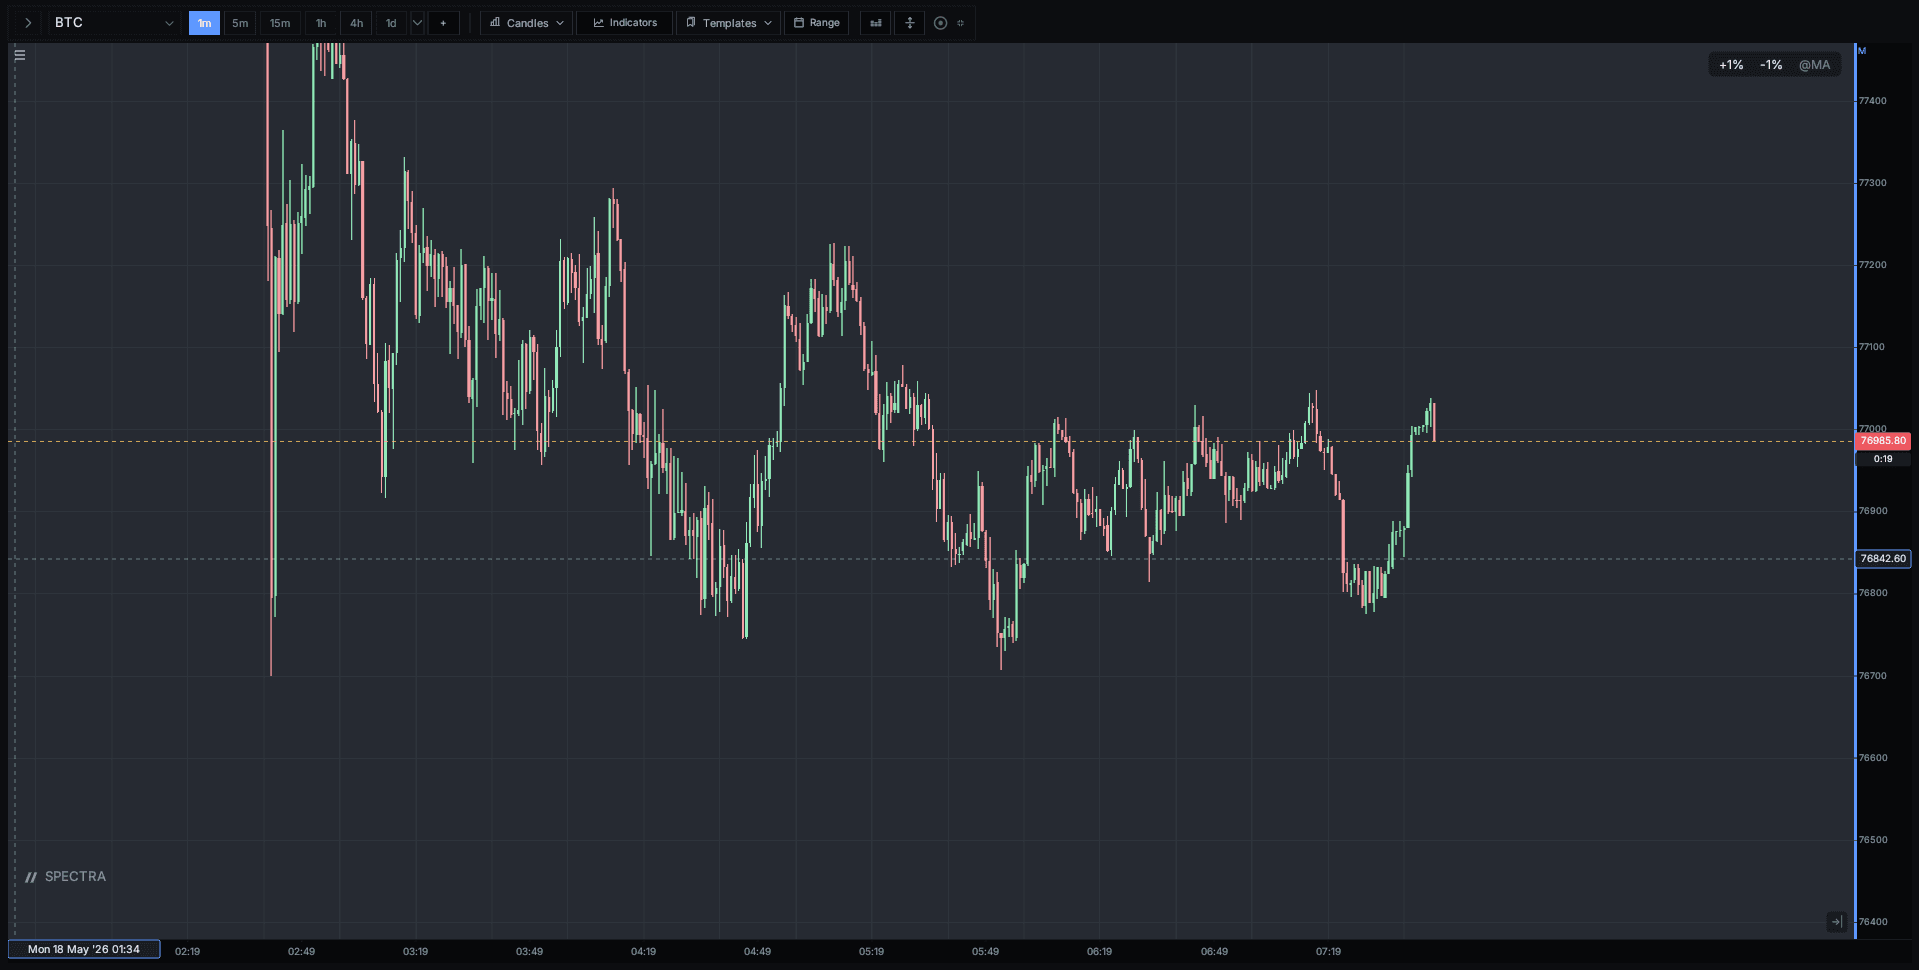
Candlestick to TPO, footprint to heatmap — every chart type uses the same native and WebAssembly engine, with cached history targets of 10,000 sub-minute bars or 50,000 standard bars.
01 · Cached history
10,000 sub-minute bars. 50,000 standard bars.
Spectra applies a deliberate history budget by interval: seconds and 1-minute charts target 10,000 bars, while intervals from 3 minutes upward target 50,000. Older pages are retained in the chart cache as you pan, zoom, and snap back to live.
- 10,000 bars for 1-second, custom sub-minute, and 1-minute charts.
- 50,000 bars for 3-minute and higher standard intervals.
- Historical pages merge without duplicates and remain cached for instant revisits.
- Snapping to current price action changes the viewport without discarding loaded history.
02 · Why so many?
Why so many?
Different markets reward different visualisations. A futures scalper lives on the footprint and DOM. A swing trader works candlesticks on the daily. An equities desk reads VWAP rotations against TPO. Spectra ships every primitive serious traders actually use, instead of forcing one paradigm.
- Every type, with a use case.
03 · Footprint, in detail.
Footprint, in detail.
Order-flow at the candle level, with the controls a tape-reader actually wants.
- Bid and ask volume printed per cell, sized by total volume.
- Imbalance highlighting at a configurable ratio (default 3:1).
- Point-of-control marker per candle and per session.
- Value area shading at 70% by default; configurable per profile.
- Cluster aggregation by tick, by N ticks, or by basis-point bands.
 BeforeAfter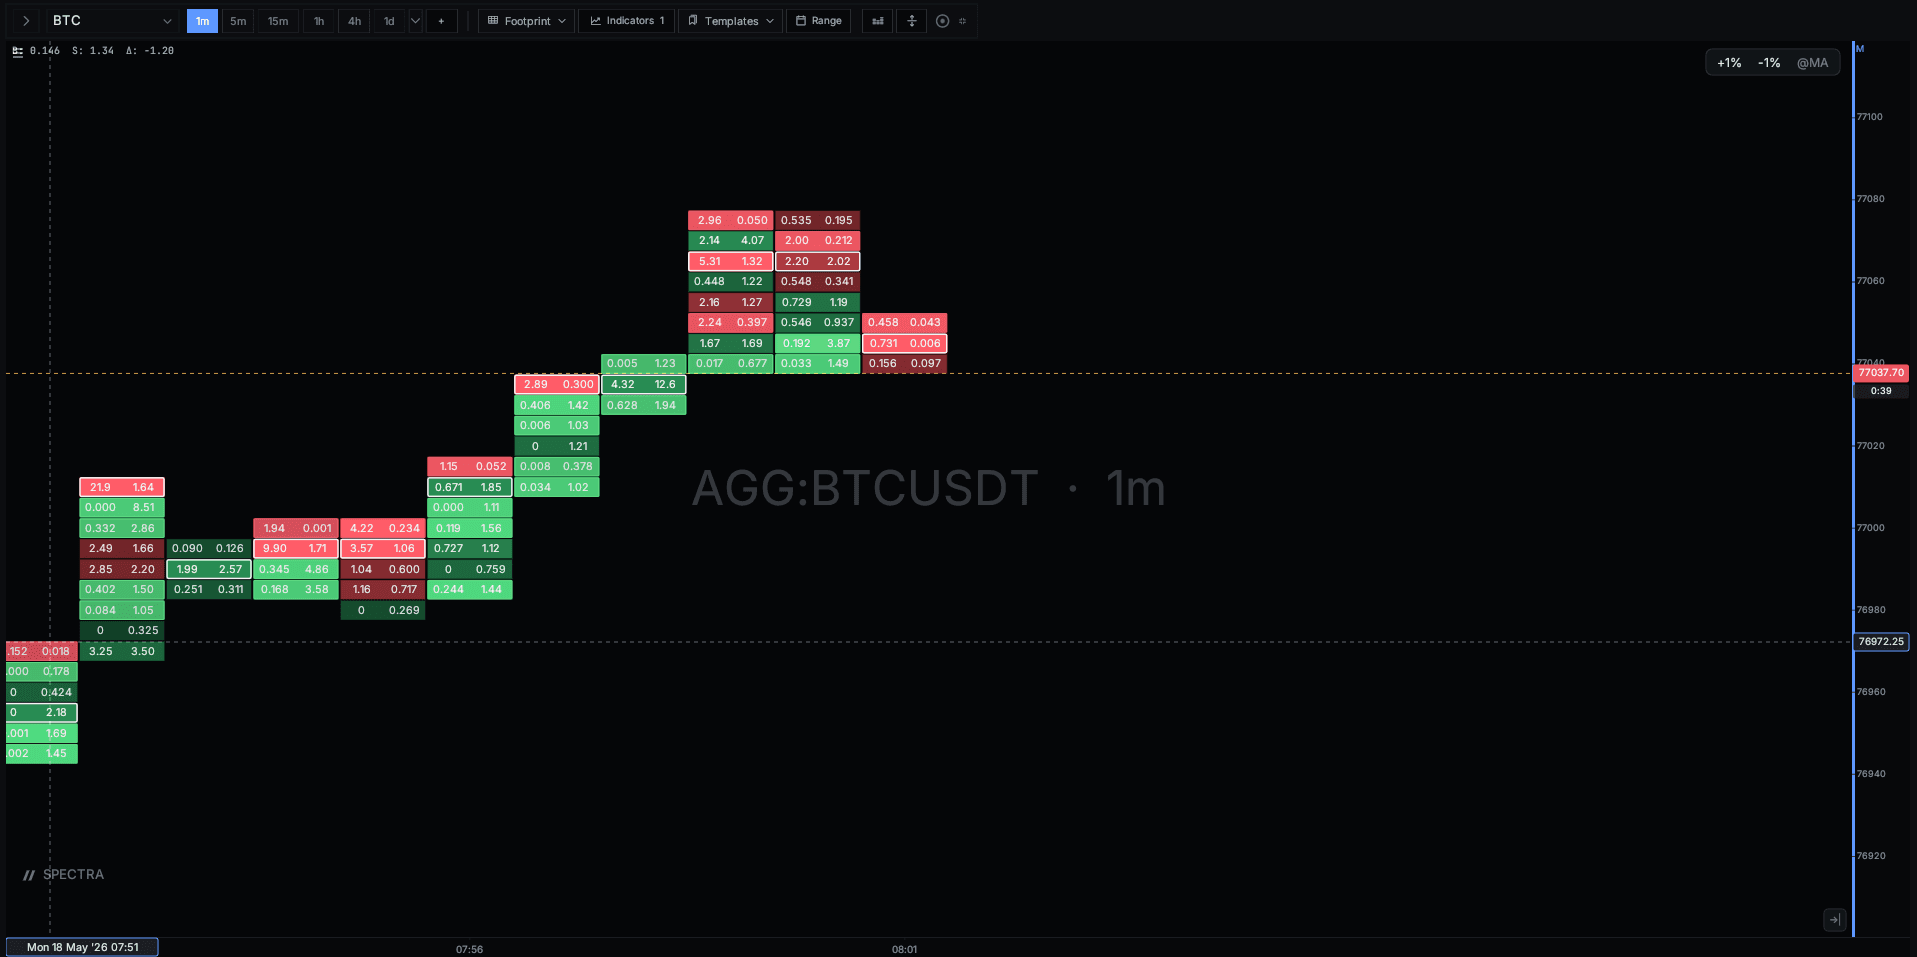
04 · Heatmap, in detail.
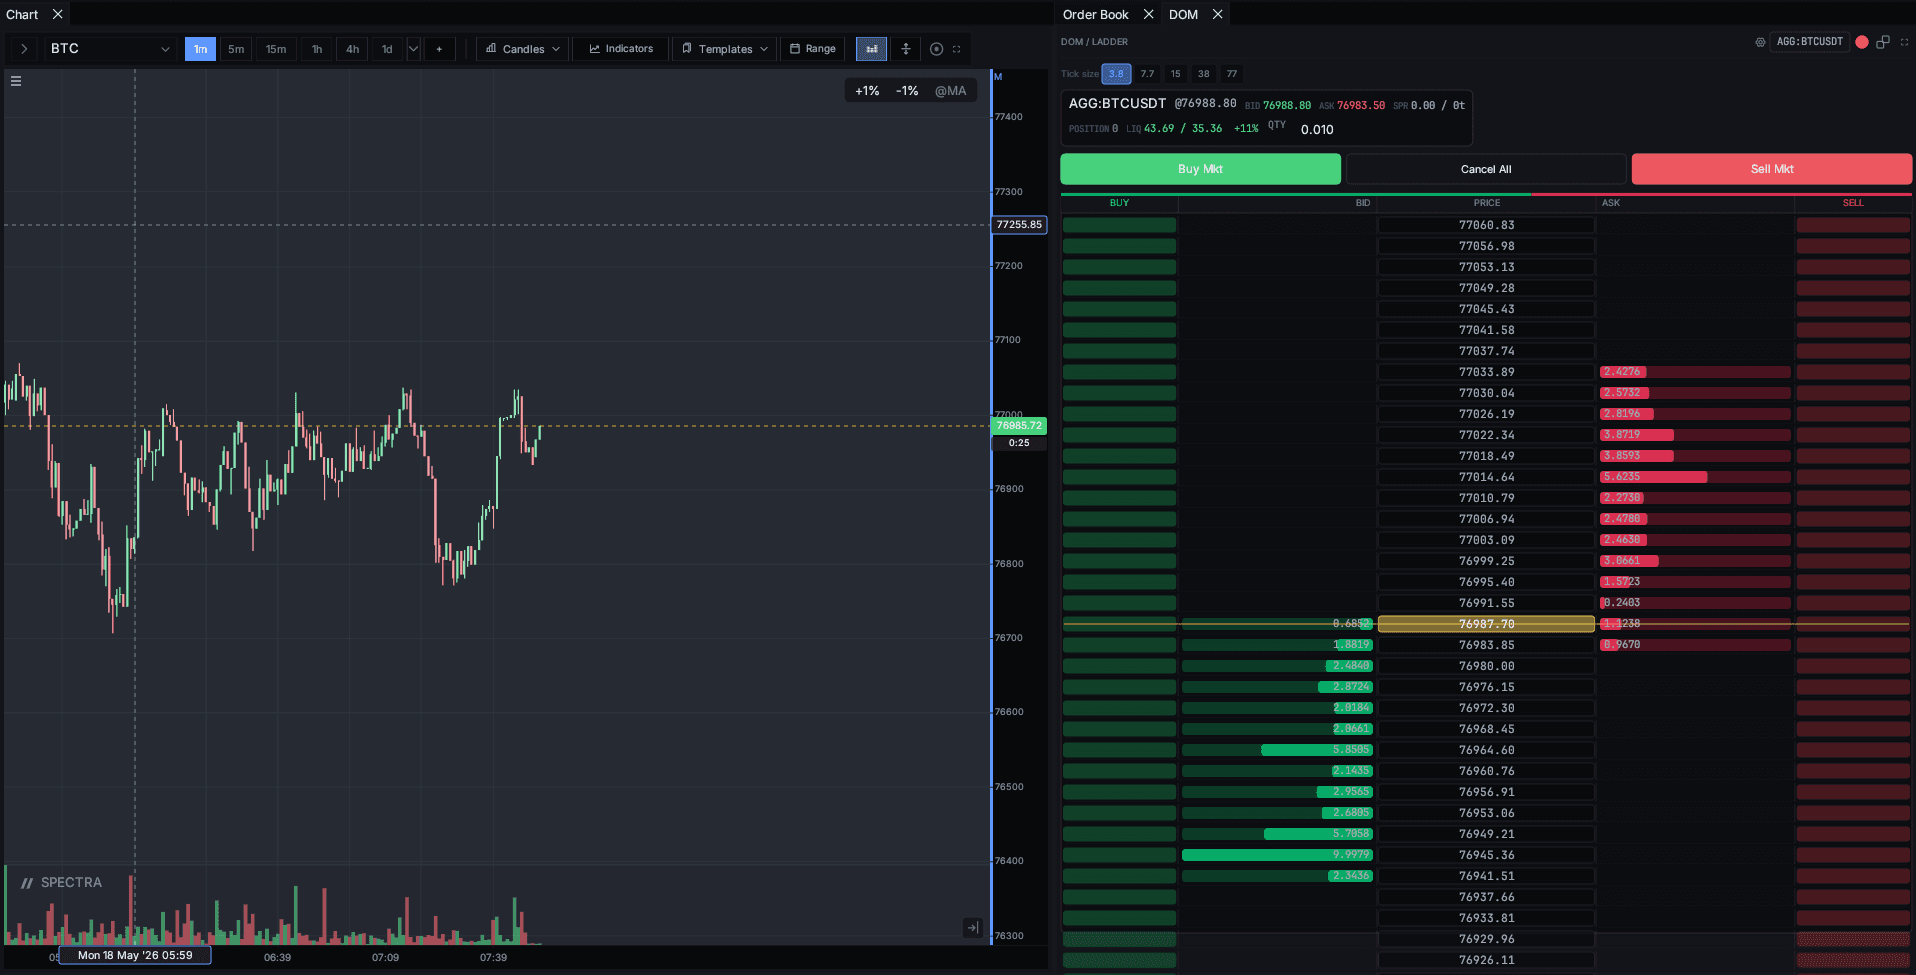
Heatmap, in detail.
L2 liquidity over time. Large orders show up before they fill.
- L2 ladder replayed at 100 ms granularity by default.
- Large-order detection at a configurable lot threshold.
- Replay scrubbing — step backward through the book without losing state.
- Price-grid binning configurable per symbol (tick size aware).
 BeforeAfter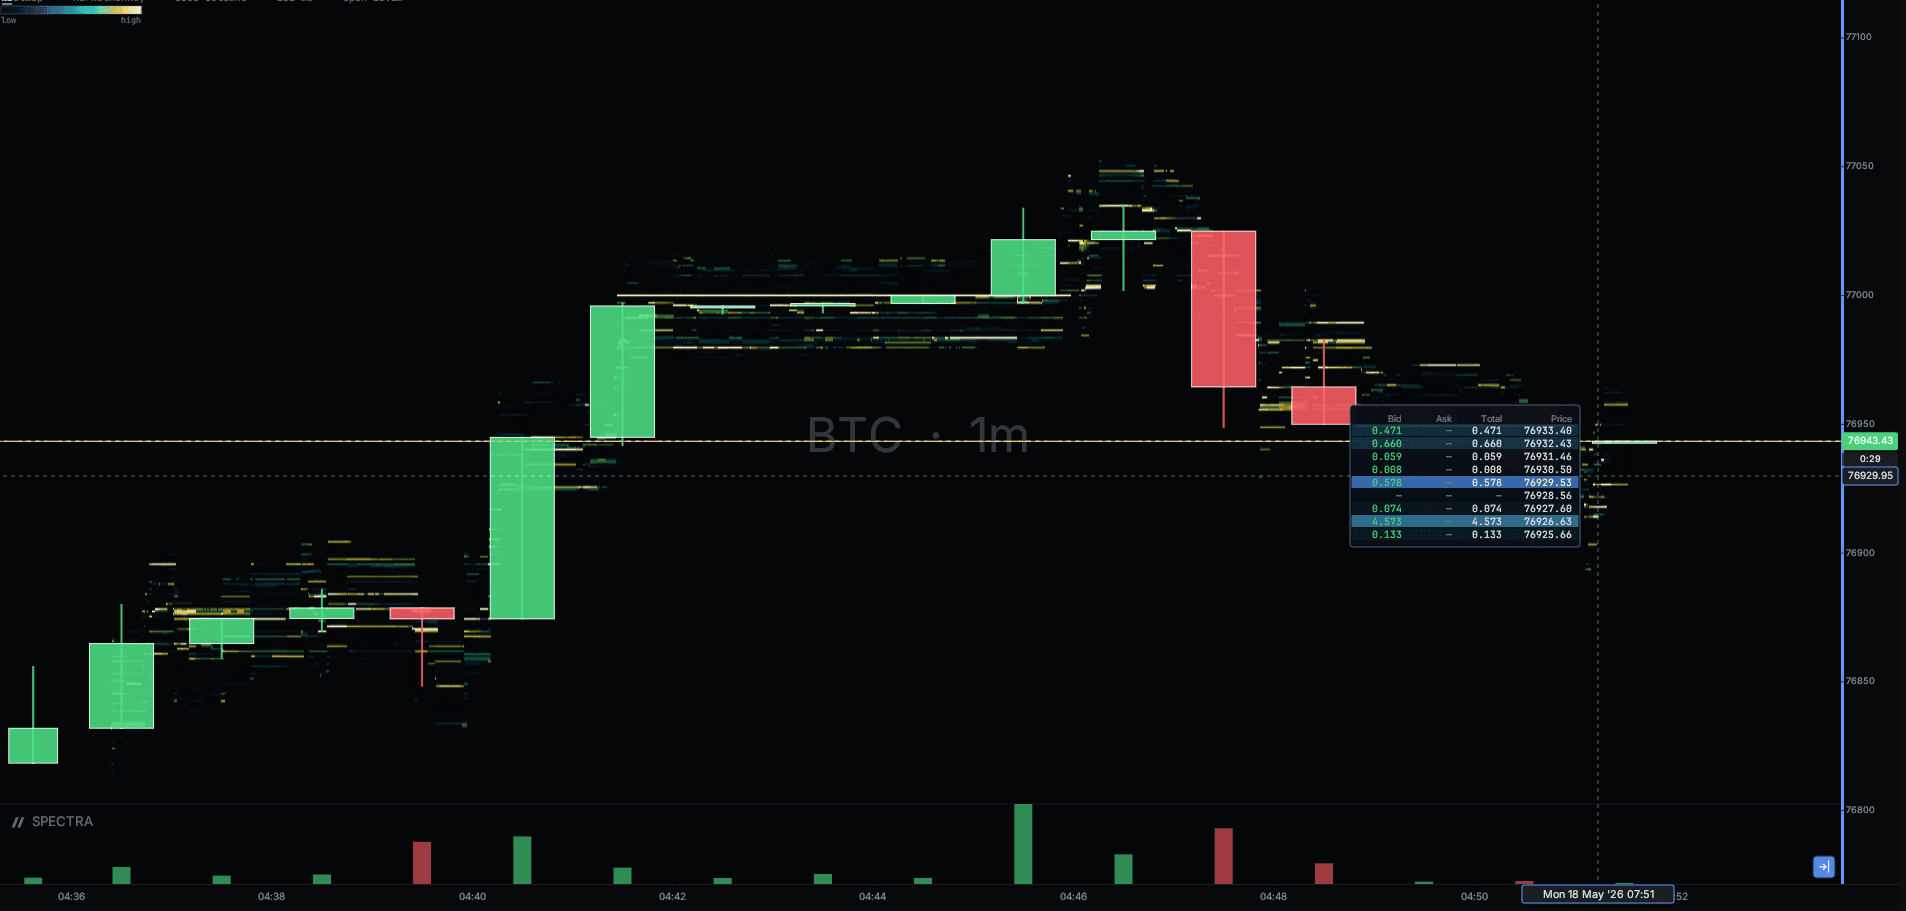
05 · Volume profile, every range mode.
Volume profile, every range mode.
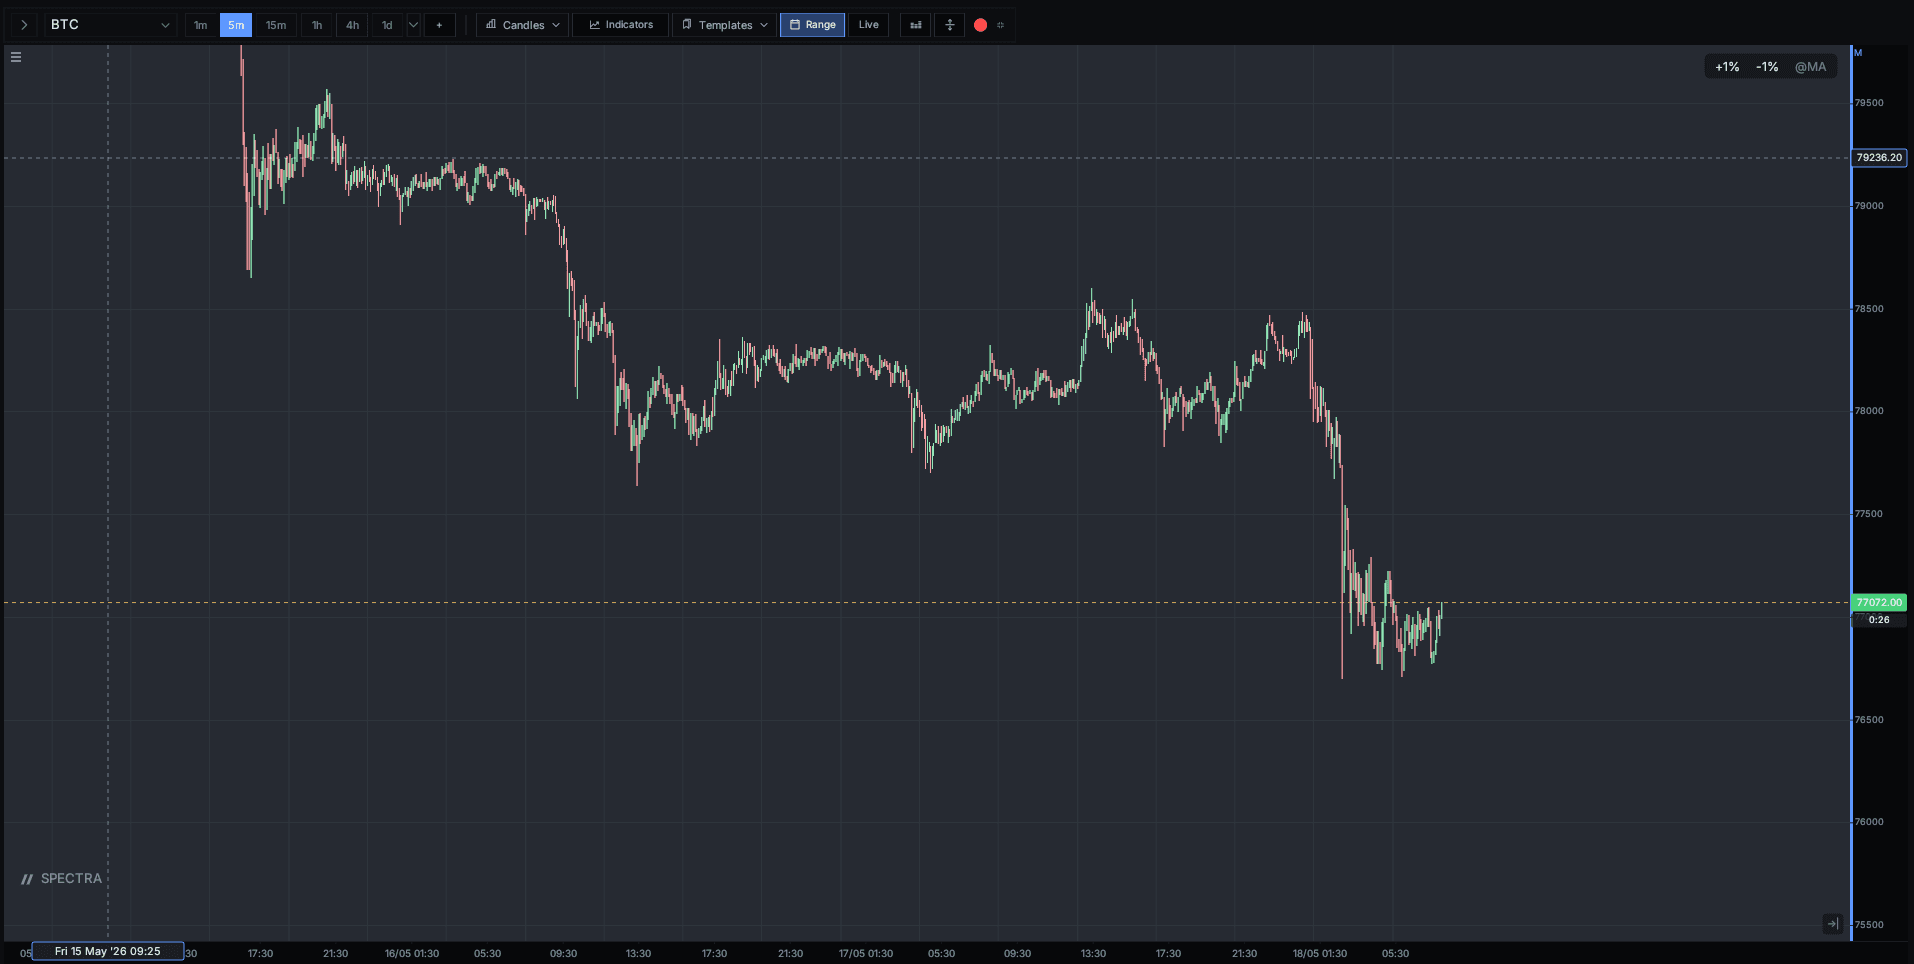
Visible-range, fixed-range, and session TPO — the same data answered three ways.
- Visible-range profile recomputes as you pan and zoom.
- Fixed-range profile anchored between two timestamps you drag-select.
- Session TPO with letters per half-hour bracket.
- Composite toggle merges the last N sessions into one profile.
 BeforeAfter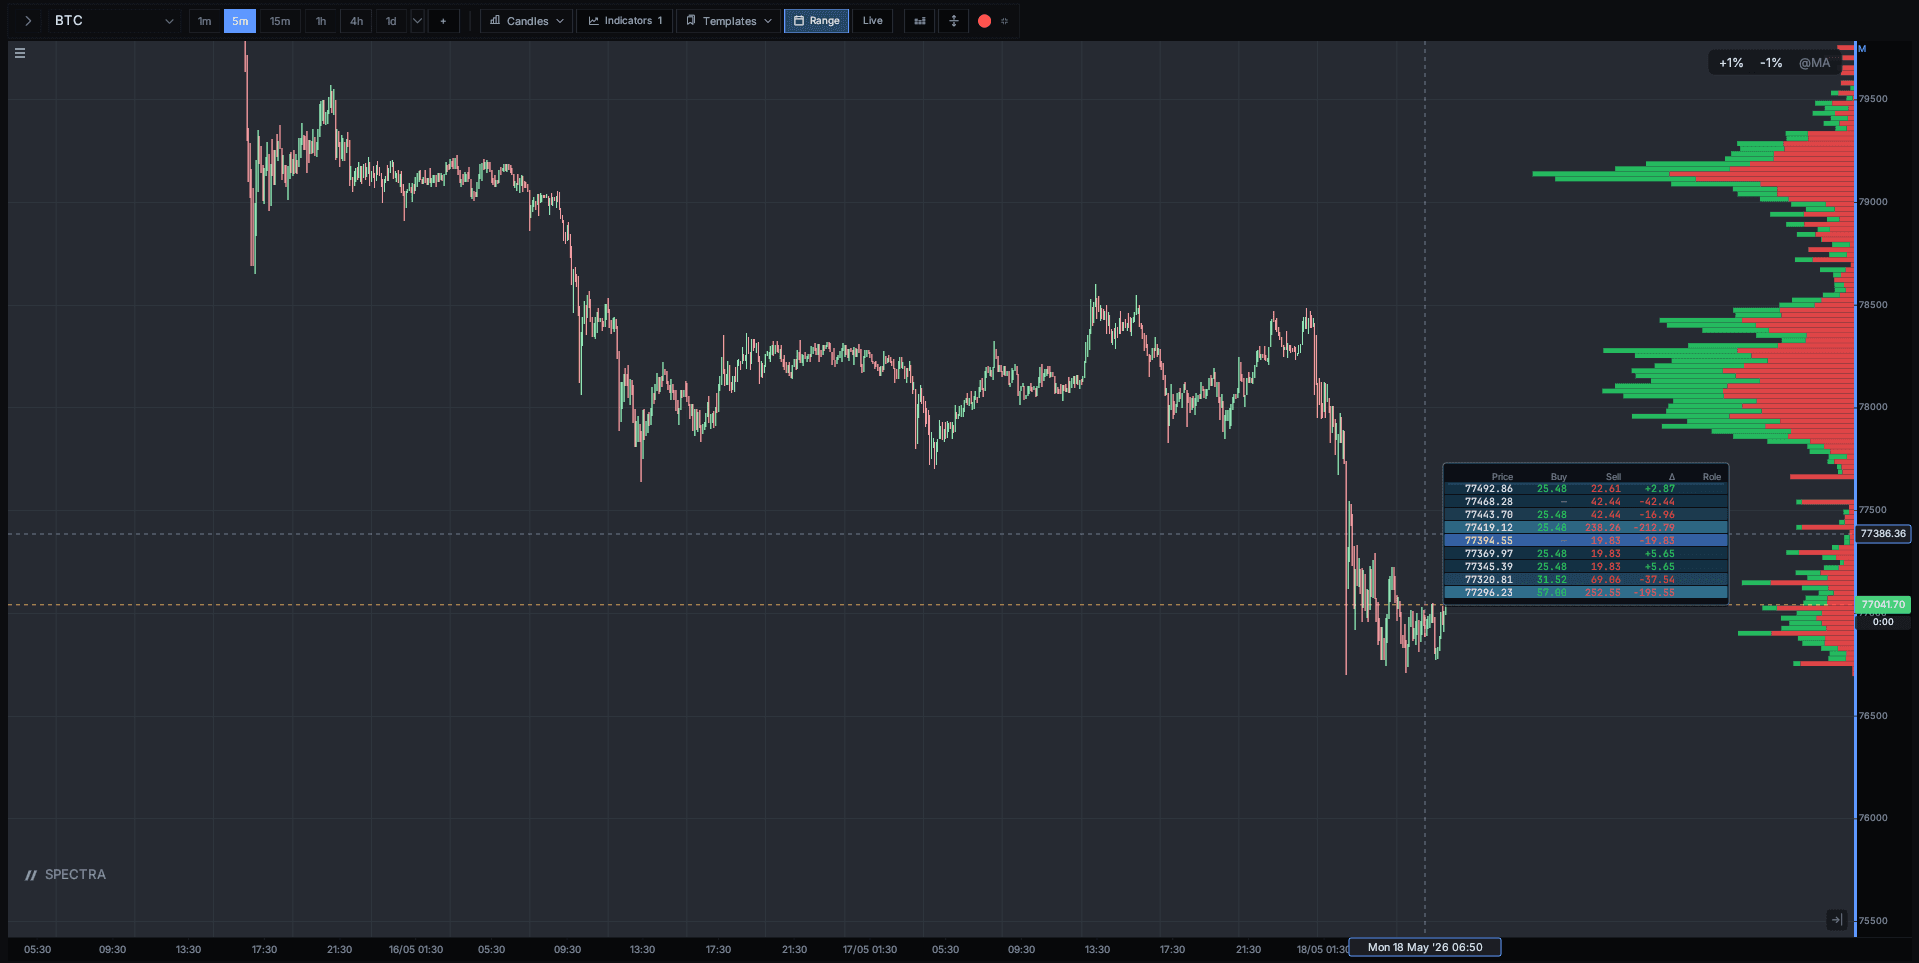
06 · Features
Every type, with a use case.
Candlestick
Use this when: Default for most discretionary trading. Open, high, low, close at a glance.
OHLC bars
Use this when: Western-style bars; same data as candles, lighter visual footprint.
Heikin-Ashi
Use this when: Trend smoothing. Use when you want to filter out chop on lower timeframes.
Line
Use this when: Close-only. Long-horizon context where wicks are noise.
Area
Use this when: Filled close-only. Reads better than a line on a presentation deck.
Baseline
Use this when: Anchored line; areas split by a reference price (entry, settlement).
Histogram
Use this when: Volume or any non-price series rendered as bars on its own pane.
Renko
Use this when: Brick-based. Filters time entirely — useful for trend-following.
Footprint
Use this when: Bid × ask volume per candle. The order-flow primitive.
Heatmap
Use this when: L2 liquidity replayed over time. See where the resting orders sit.
TPO (market profile)
Use this when: Time-price opportunity letters per session. Acceptance and rotation.
Stop renting 2014. Trade like it's the floor.
Free during launch — every feature included, no card, no trial countdown.