
Scripting reference
The Spectra DSL: five script kinds, sandboxed bytecode VM, three runtimes.
The Spectra DSL is a small, statically-typed language designed to express trading logic without scaffolding. It compiles to bytecode that runs in three places — chart preview, the backtester, and the 24/7 cloud worker.
What to read first
- Grammar — keywords, types, and the expression grammar in EBNF.
- Built-in functions —
sma,ema,rsi,crossover, etc. - Script kinds — Indicator, Alert, Screener, Drawing, Strategy, with the surface each one targets.
- Sandbox limits — CPU and memory budgets, what the VM forbids, and how to opt into longer windows.
- Tick-based scripting — individual
executions,
on_trade, server alerts, and archive tick replay.
Hello, indicator
// @spectra-script 2
// Plot the 20-period SMA on the price pane.
let m = ta.sma(close, 20)
plot.line("SMA 20", m, color = color.orange, width = 2.0, force_overlay = true)
output m
Hit Run Preview (or Save) and the line draws on the chart. Recompilation on every keystroke fires under 80 ms — you see the line move as you change the period.
The script editor
Open the Scripts panel from the top menu — or View → Add Panel → Scripts — and it docks like any other widget, so you can split it beside the chart. The Editor tab is a first-class code editor:
- Syntax highlighting across the whole
ta./plot./param./color.surface. - Autocomplete — start a built-in (e.g. type
ta.) and pick from the list; ↑/↓ to move, Enter/Tab to accept. - Live diagnostics — a red underline on the offending span plus a Problems strip, recompiled as you type.
- Pop out to Monaco — the same editor VS Code uses, in a detached window for a full-IDE feel.
On the web build the docked editor is Monaco, mounted right in the panel. A pinned toolbar keeps Save / Revert / Run Preview in reach no matter how long the script gets — the code scrolls inside its own box.
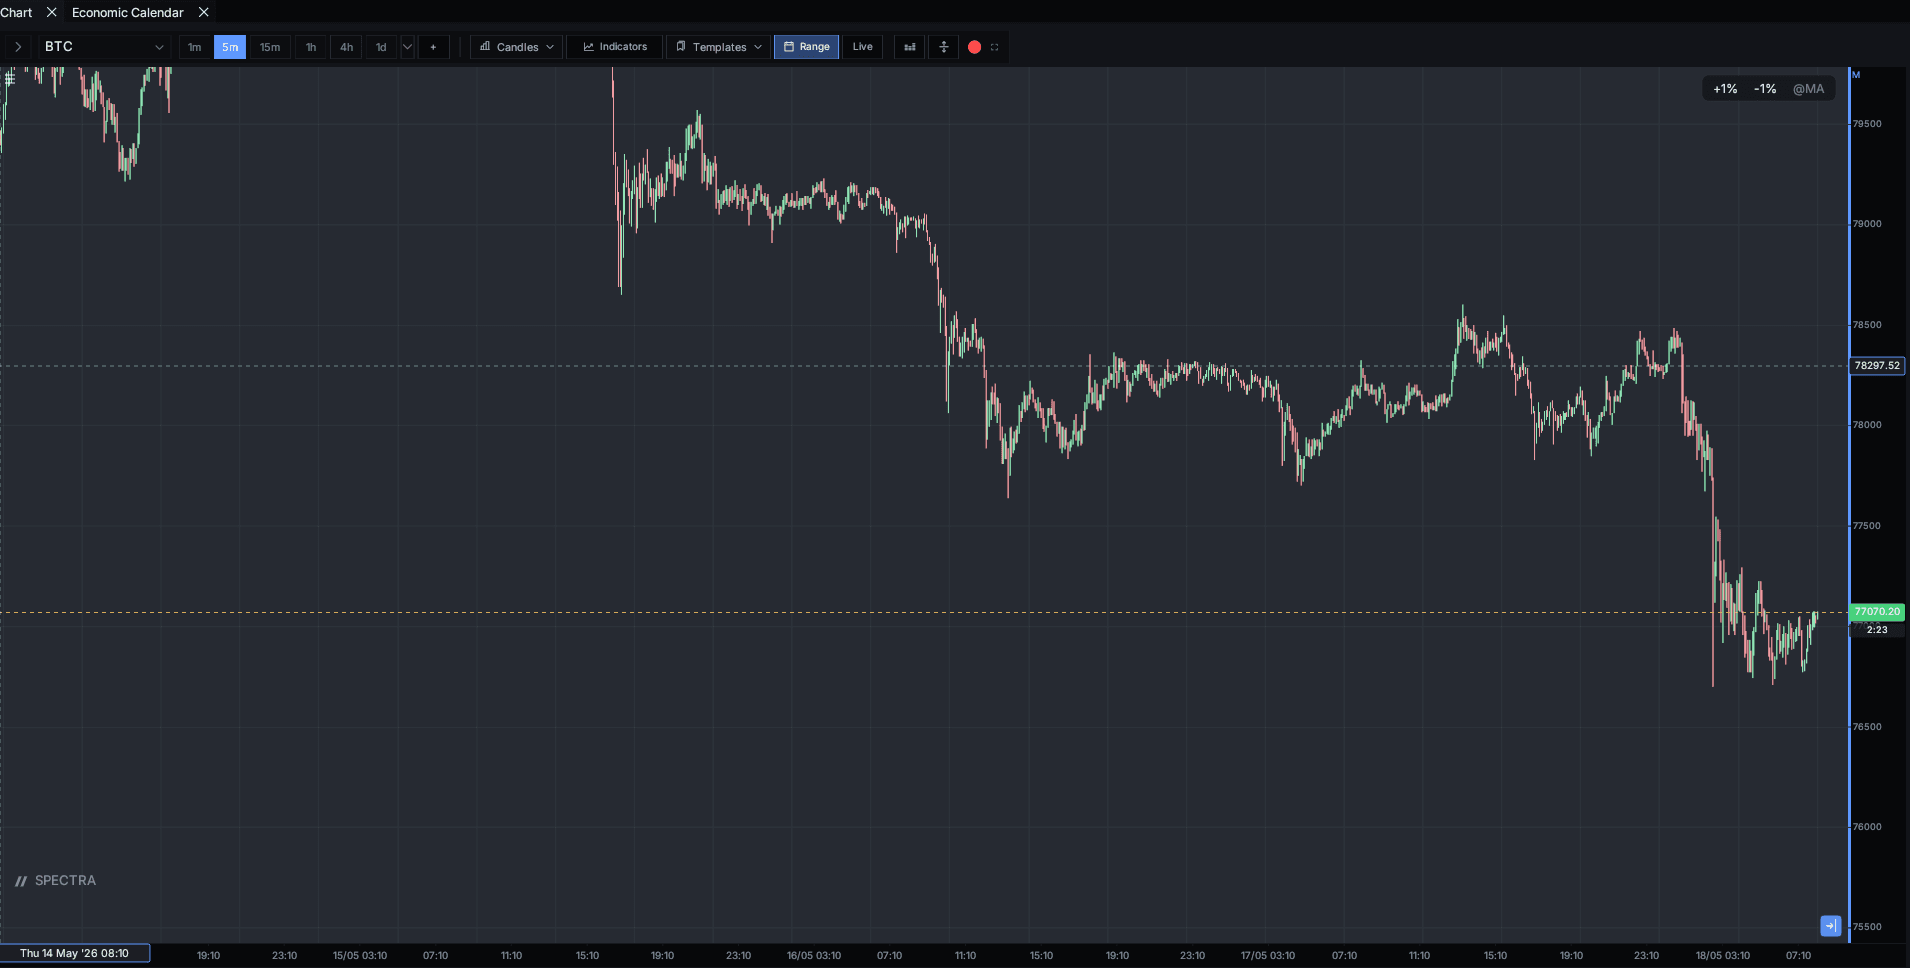 BeforeAfter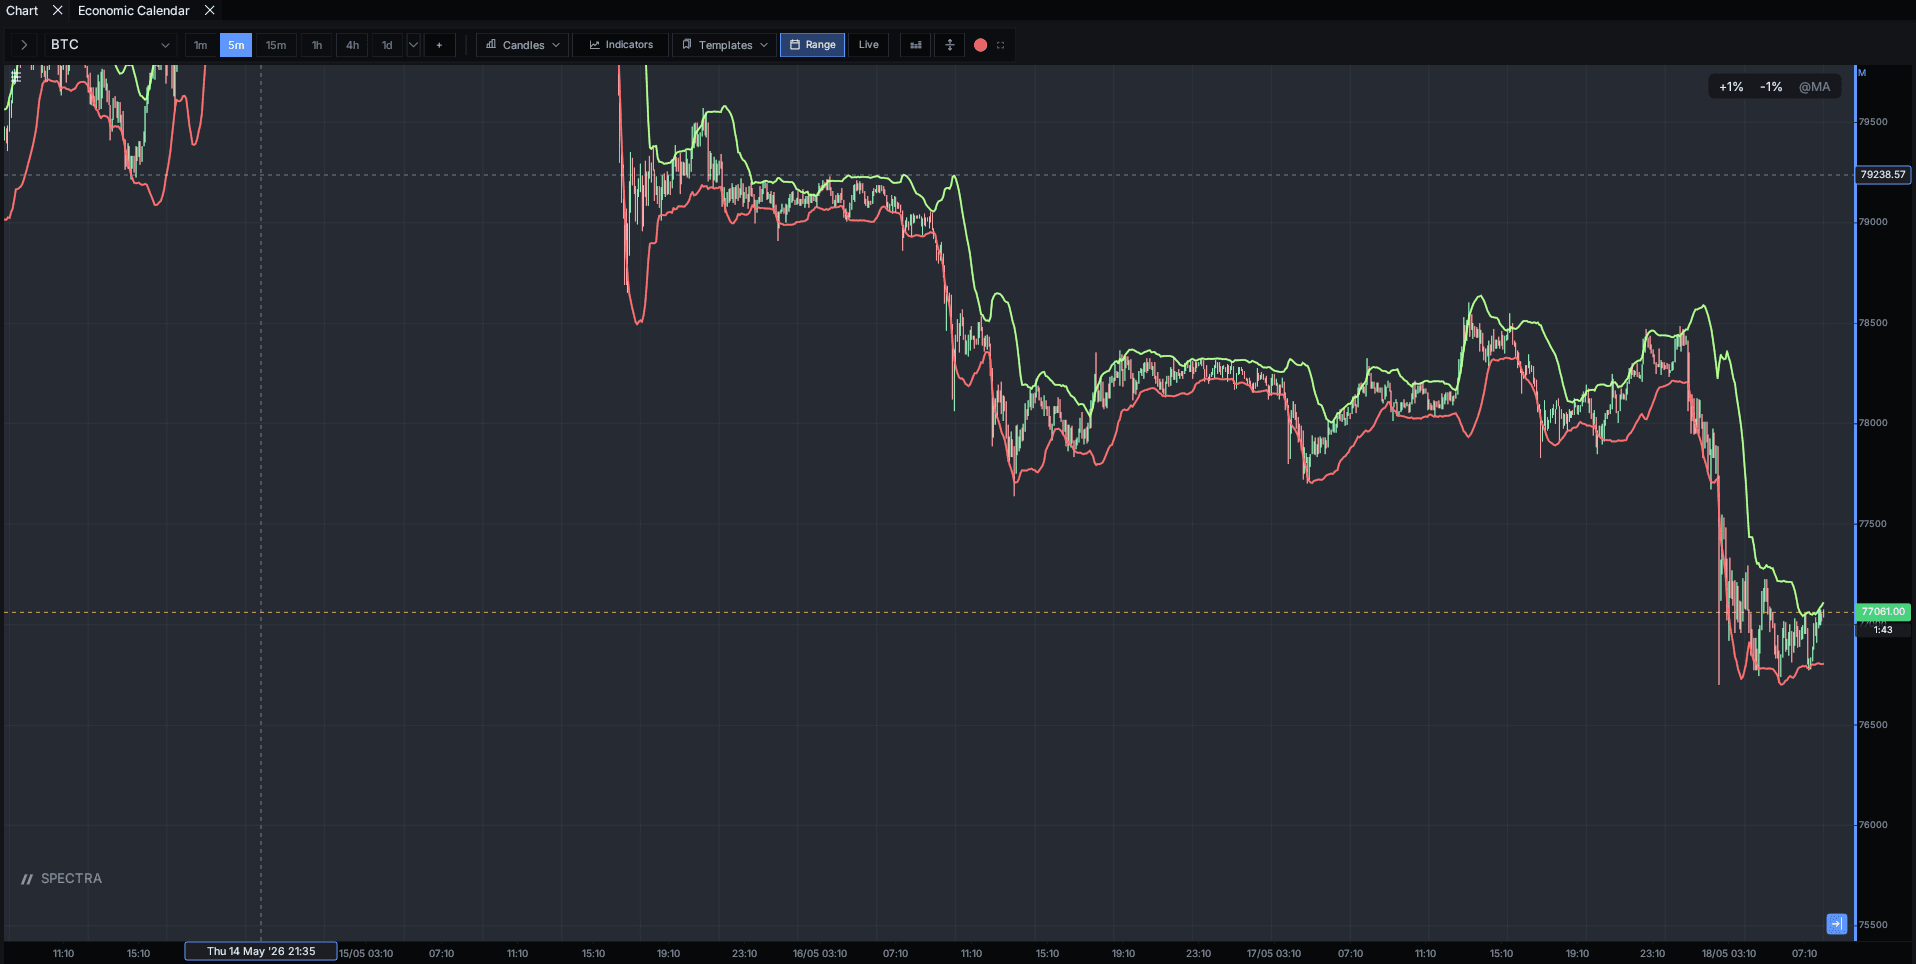
Strategy in five lines
let fast = sma(close, 12)
let slow = sma(close, 26)
if cross_up(fast, slow) { buy(qty: 1) }
if cross_down(fast, slow) { sell(qty: 1) }
output fast - slow
The same file backtests against historical bars in the Strategy panel and fires real orders in live mode — no flag flips required. The auto-flip rule (see Script kinds) ensures indicator-style strategies actually close their positions.
Where to go from here
If you're coming from Pine Script, the most useful page is Grammar — the surface area is similar but the type system is stricter. If you're coming from C-like languages, start at Built-in functions instead.