
charts
Heatmap
L2 liquidity over time. Large orders show up before they fill.
The heatmap replays the order book at fixed-time slices, painting each price level by resting size. Where the heat sits over time is where the market expects support / resistance to actually transact.
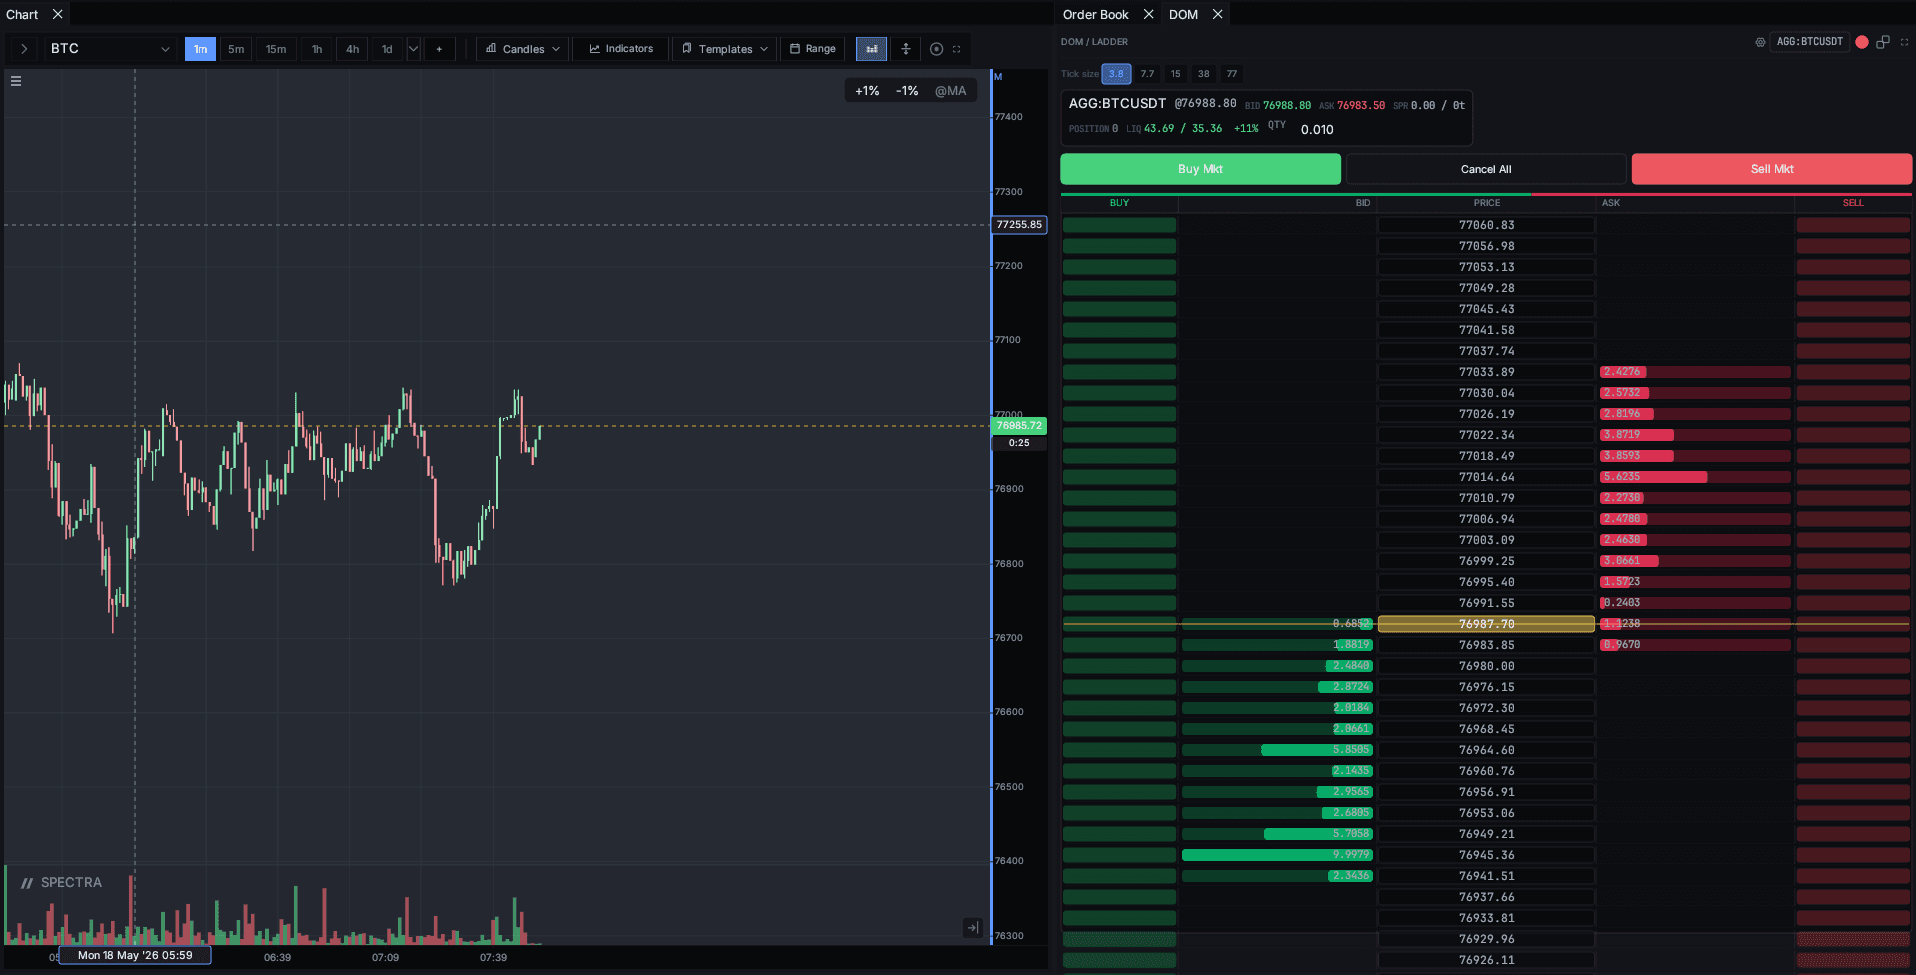 BeforeAfter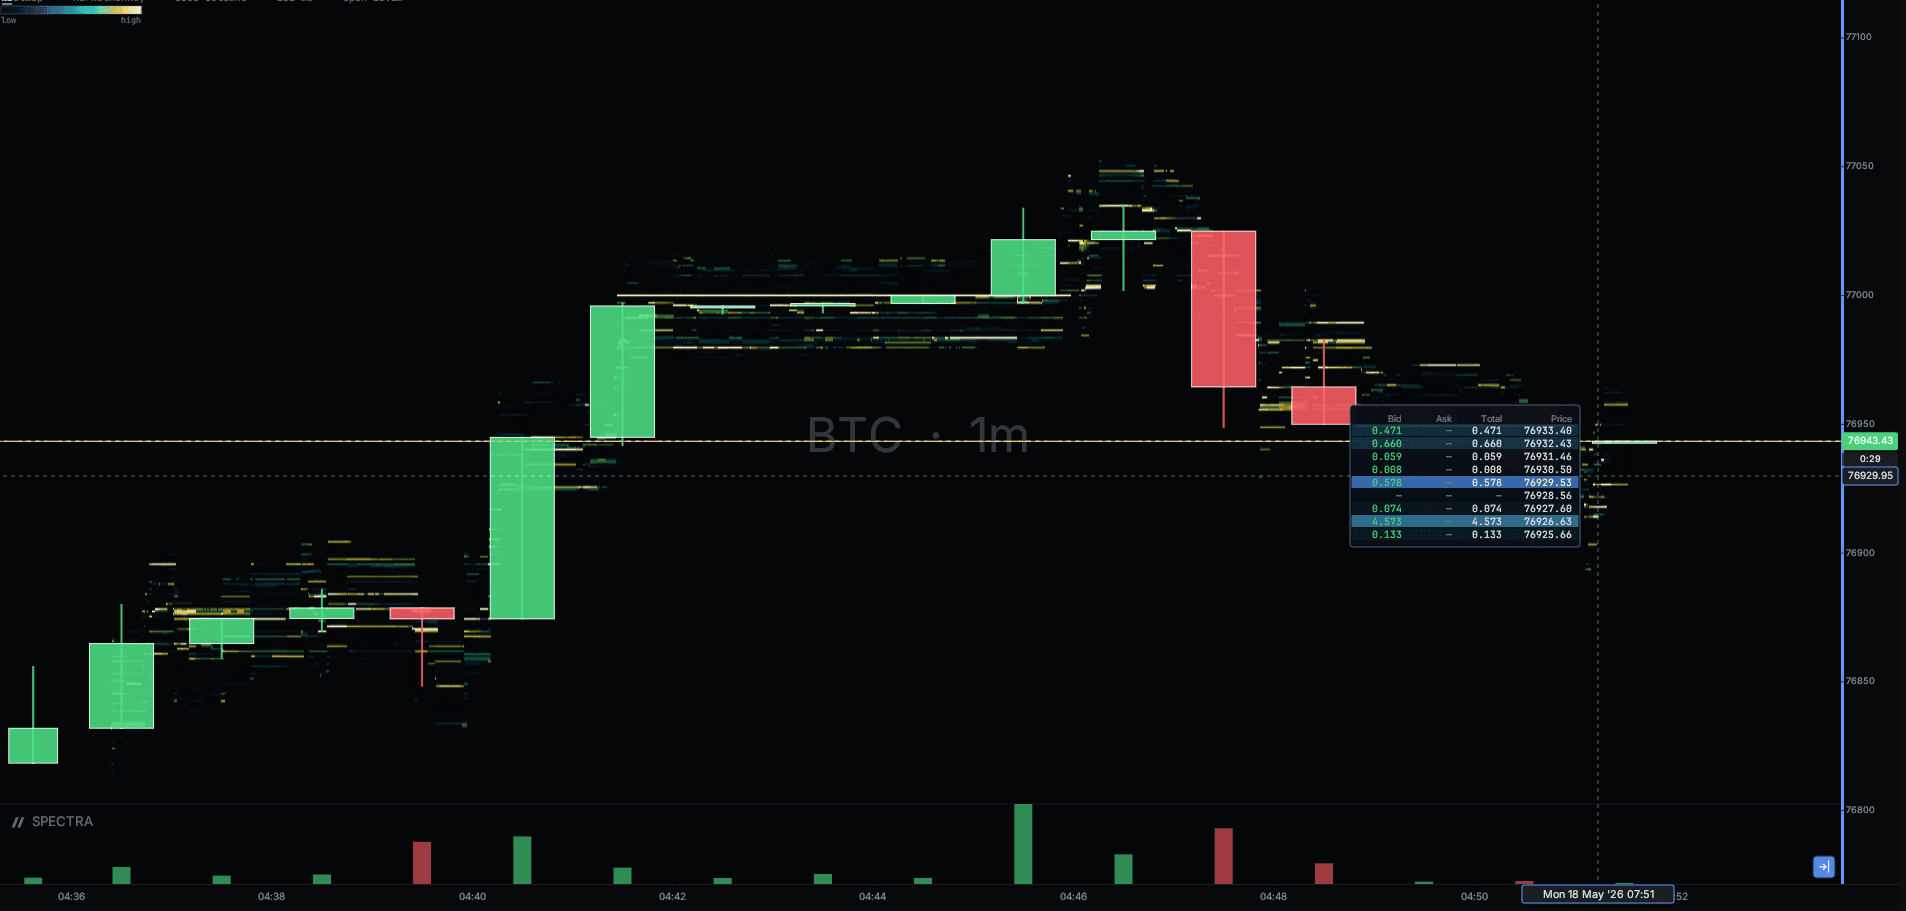
Replay
Default granularity is 100 ms. Reduce on lower-volatility instruments to see structure; increase on high-frequency markets to manage CPU.
Replay → 100 ms / 500 ms / 1 s / 5 s
Use the time scrubber at the bottom to step backward without losing state.
Large-order detection
Resting orders above the lot threshold (default 25 contracts on
futures, configurable per symbol) draw with a brighter alpha and trigger
a large_order_detected event you can wire into a script alert.
Price-grid binning
Bins follow the symbol's tick size by default. For ultra-fine markets
(perpetuals at 0.01 tick), enable Aggregate to N ticks to keep the grid
readable.
Combining with footprint
A standard order-flow setup pairs the footprint on the candle and the heatmap on a horizontal companion pane. Drag the heatmap pane height to 20–30% of the chart and use shared crosshair for sync.