
charts
Footprint
Bid × ask volume per candle, imbalance highlighting, point-of-control, and value area.
Footprint splits each candle into a grid of price levels. Each cell shows bid volume × ask volume, sized by total volume.
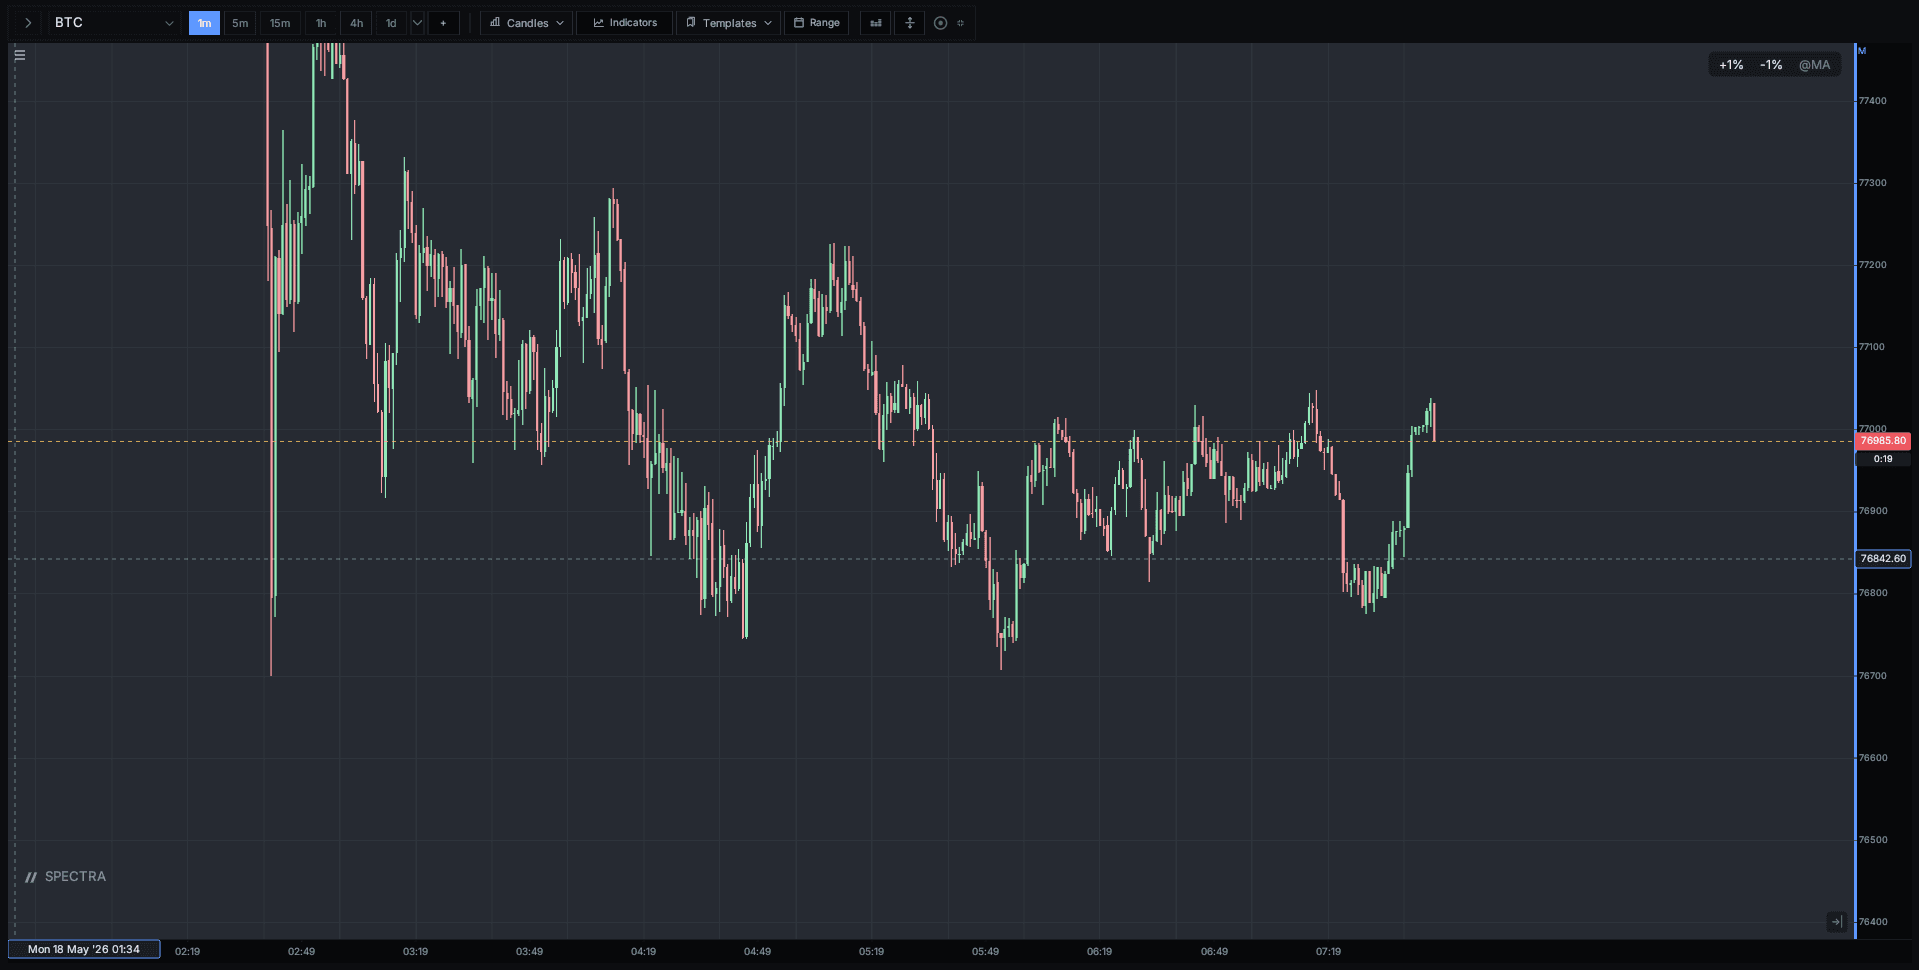 BeforeAfter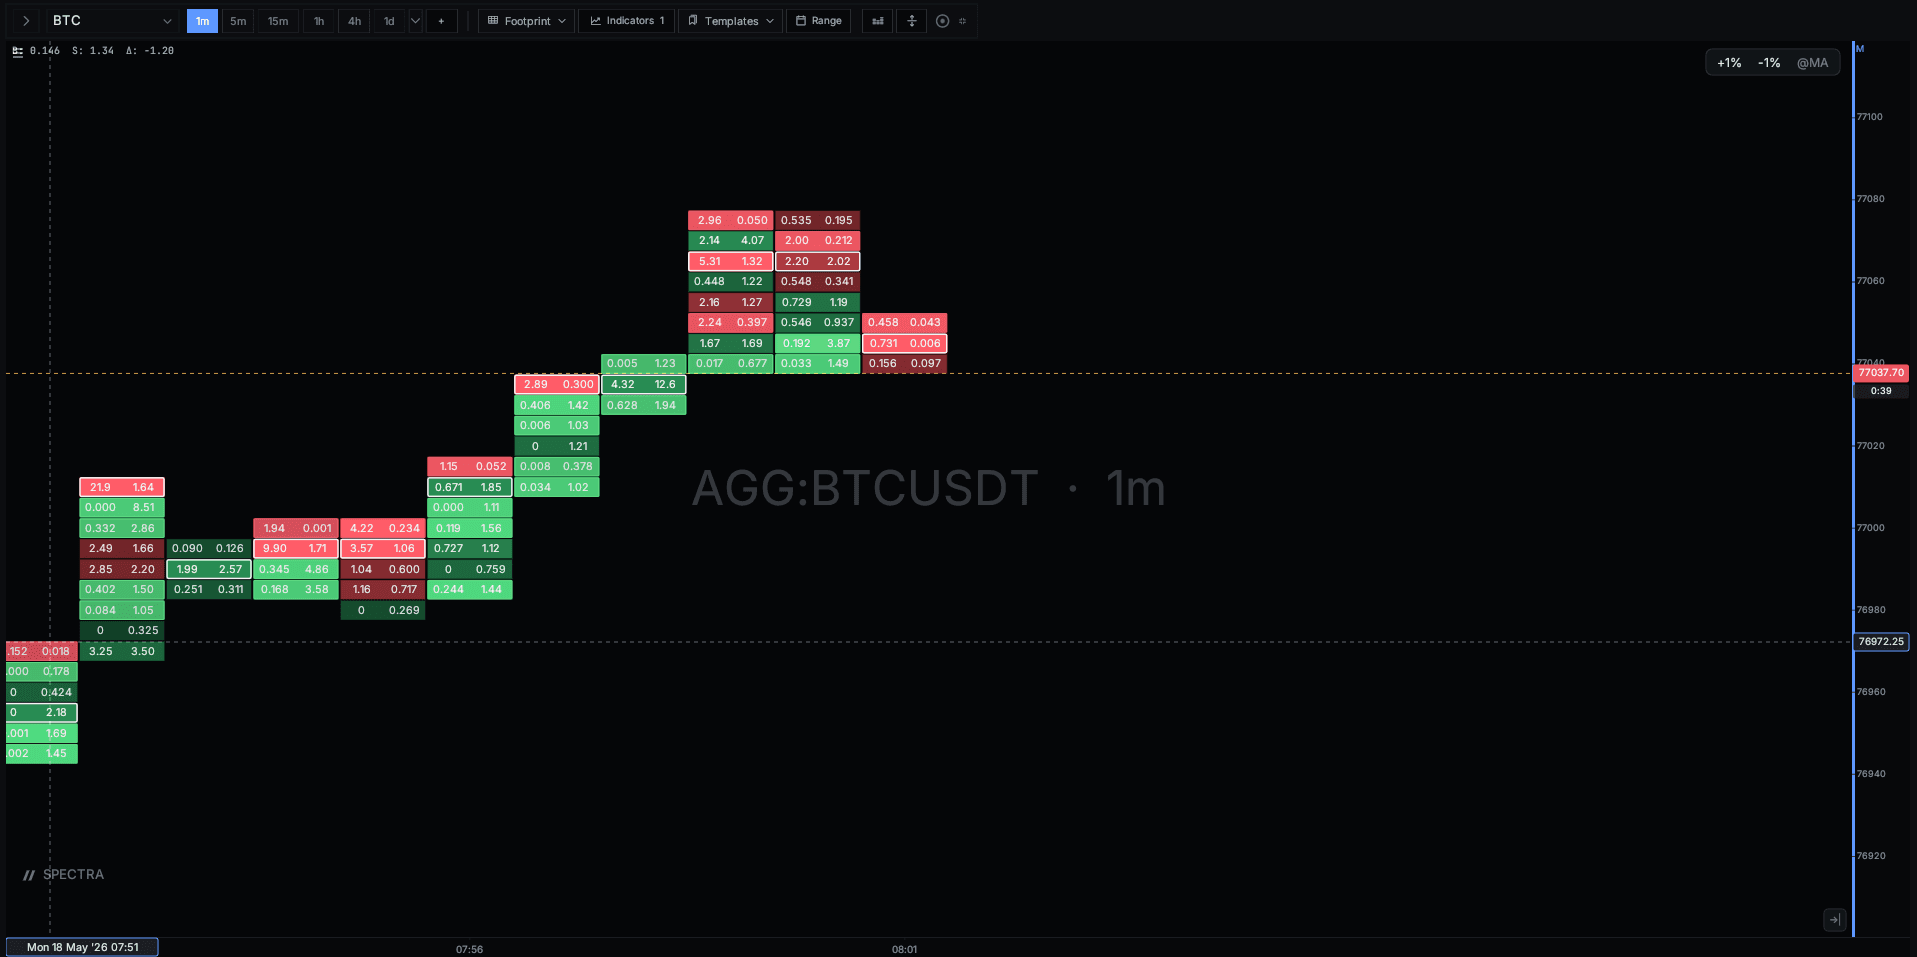
Cell aggregation
Aggregation:  by tick   |  by N ticks   |  by basis-point bands
Default:      by tick on futures, by N ticks on equities
Right-click the chart → Footprint settings to change.
Imbalance highlighting
Cells where bid:ask ratio crosses a threshold (default 3:1) are
highlighted. Bid-side dominance shows in bull color, ask-side in bear.
Point-of-control (POC)
The price level with the most volume in the candle. Marker is rendered as a horizontal line through the cell. Per-session POC is also drawn in the margin.
Value area
The contiguous range that captured 70% of the candle's volume by
default — configurable per profile (50–80%). Shaded in accent.
Performance
The renderer streams cells incrementally — even on a 5,000-bar visible
range, redraws stay under 16 ms on an M2 Air. Reduce Cells per bar if
your machine struggles on a heavy intraday session.