
charts
Volume profile
Visible range, fixed range, session profile (TPO), POC plus value area.
Volume profile (VPVR) renders a horizontal histogram against the price axis: how much volume traded at each price level over a given window.
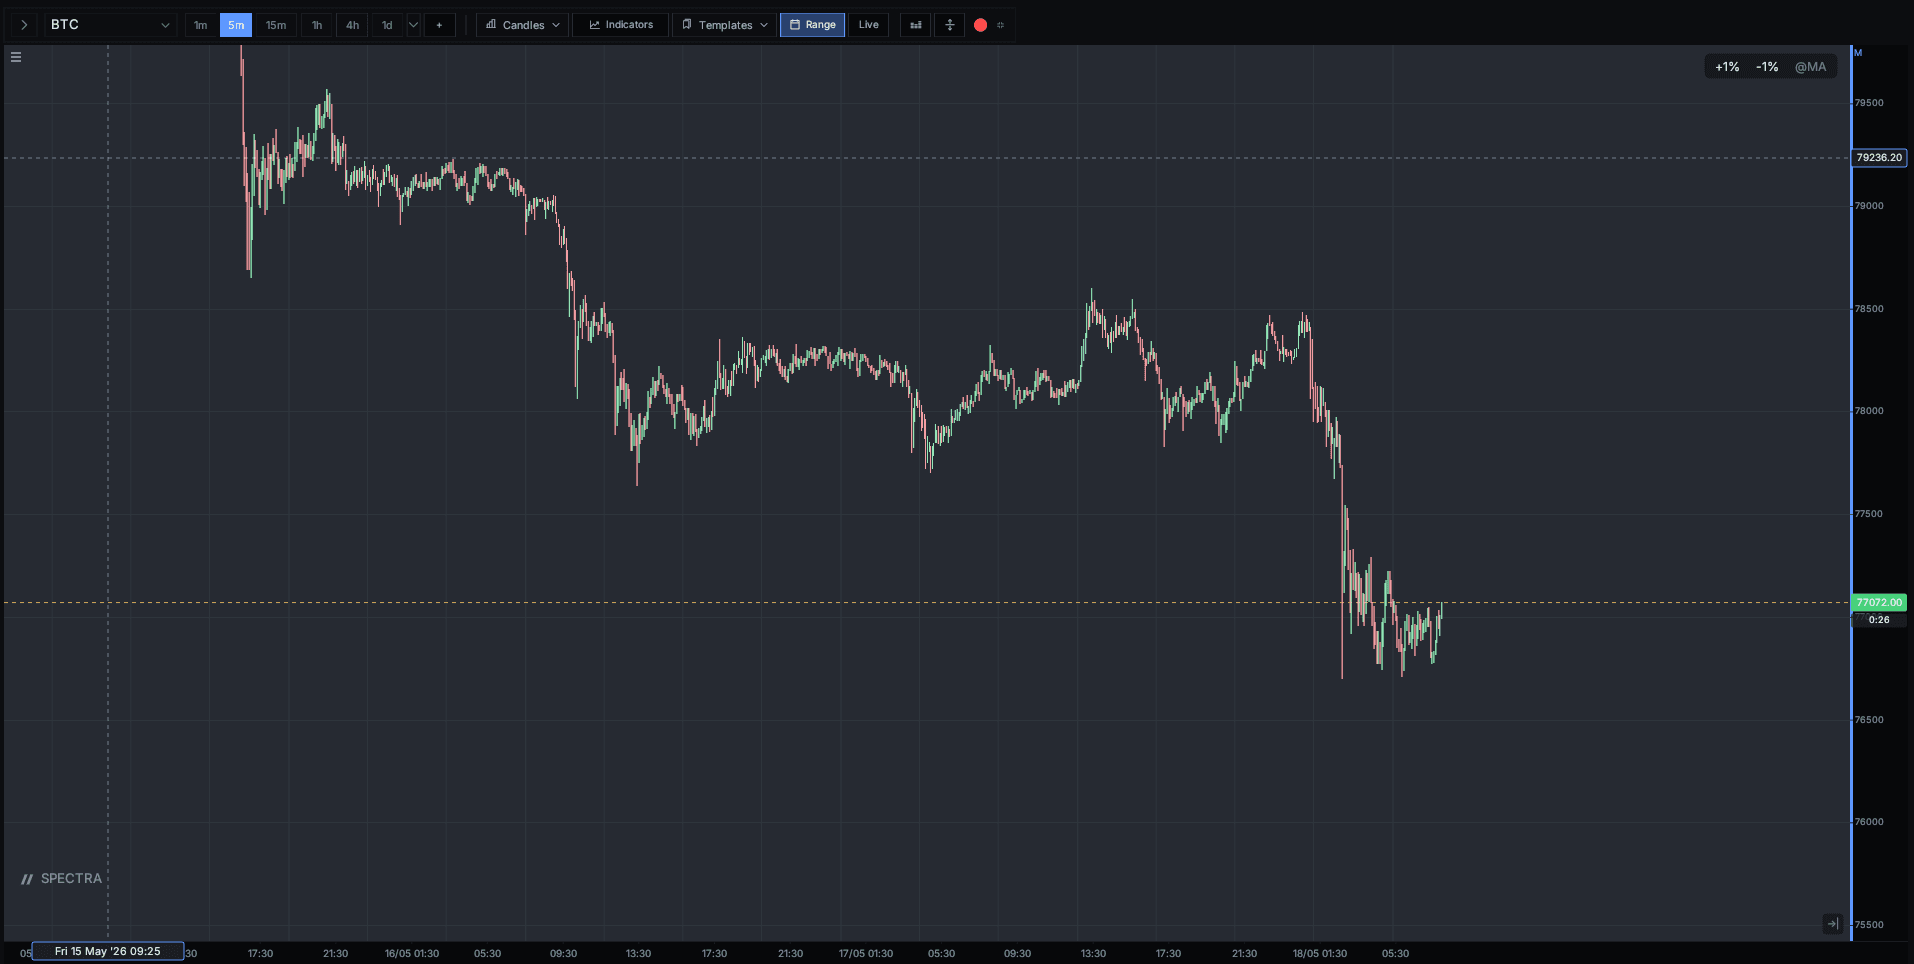 BeforeAfter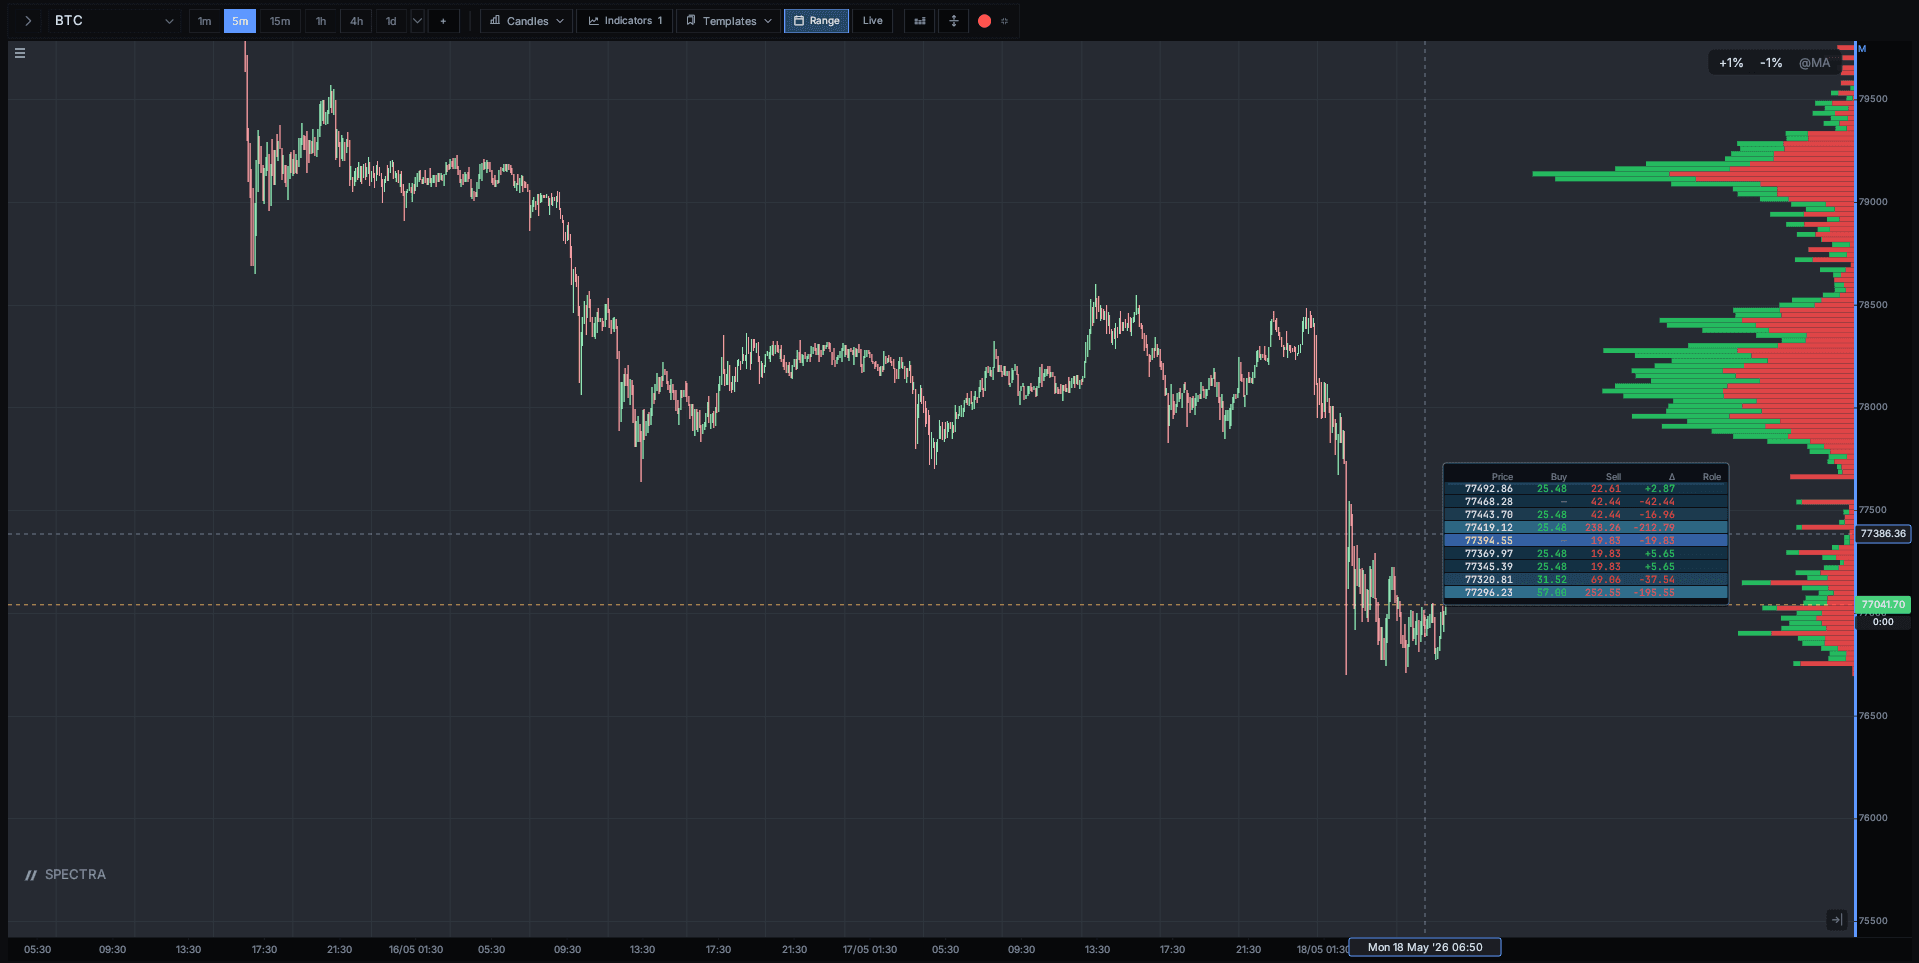
Range modes
- Visible range (VPVR) — recomputes whenever you pan/zoom. Best for exploring structure.
- Fixed range — anchored between two timestamps (drag-select on the chart). Stays put as you scroll.
- Session profile (TPO) — one profile per session, letters per half-hour bracket per market-profile convention.
POC and value area
The point-of-control marker is drawn as a horizontal accent line at the volume peak. The value area shades the contiguous range capturing the configured percentage (default 70%). Value-area-high (VAH) and value-area-low (VAL) labels appear on the right axis.
Day-vs-composite
Toggle Composite to merge the last N sessions into a single profile.
Useful for finding multi-day acceptance levels that intraday volatility
hides.
Linking to footprint
Volume profile and footprint answer different questions on the same data — where volume sat (profile) vs. who hit it (footprint). Run both in adjacent panes when reading consolidations.